
Model Router Benchmarks

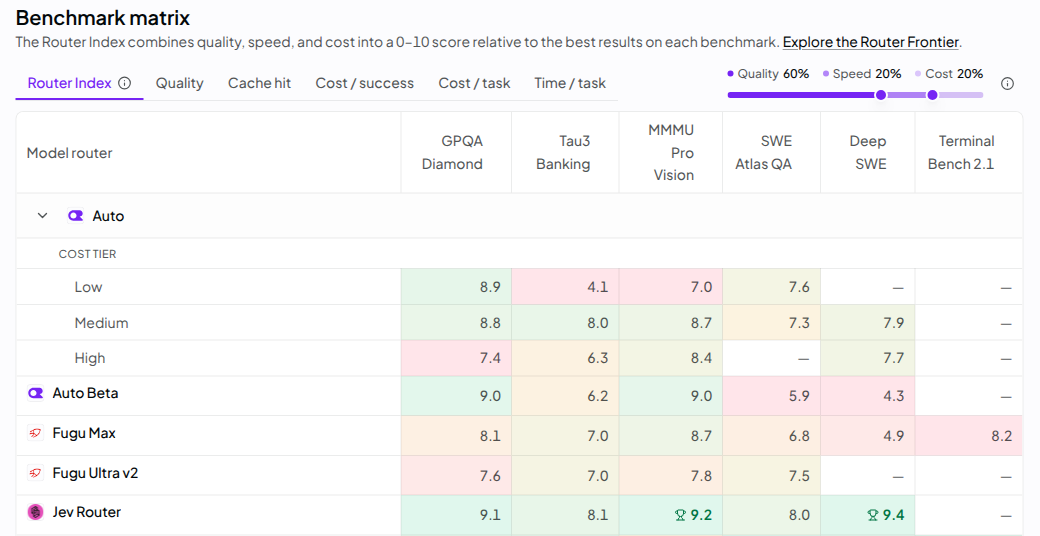
Model Router Benchmarks: A Deep Dive into Measuring LLM Routing Performance
Model router benchmarks are one of the most misunderstood measurement problems in modern AI infrastructure. Teams routinely publish latency charts for GPT-class, Claude-class, and Gemini-class models, then assume the numbers describe their application. They usually don't. The moment you place a router, gateway, or policy layer between your service and the provider, you have introduced a new system with its own performance envelope — and that system deserves its own benchmarks.
This deep dive covers what actually happens inside a routing layer, how to build a benchmarking harness that isolates routing quality from model quality, which hidden signals predict production success, and how to interpret results without fooling yourself. The focus is informational and technical: advanced concepts, implementation details, and the edge cases that separate a benchmark you can trust from one that merely looks impressive.
1. What Model Router Benchmarks Actually Measure
1.1 The Router as a Decision Layer, Not a Model
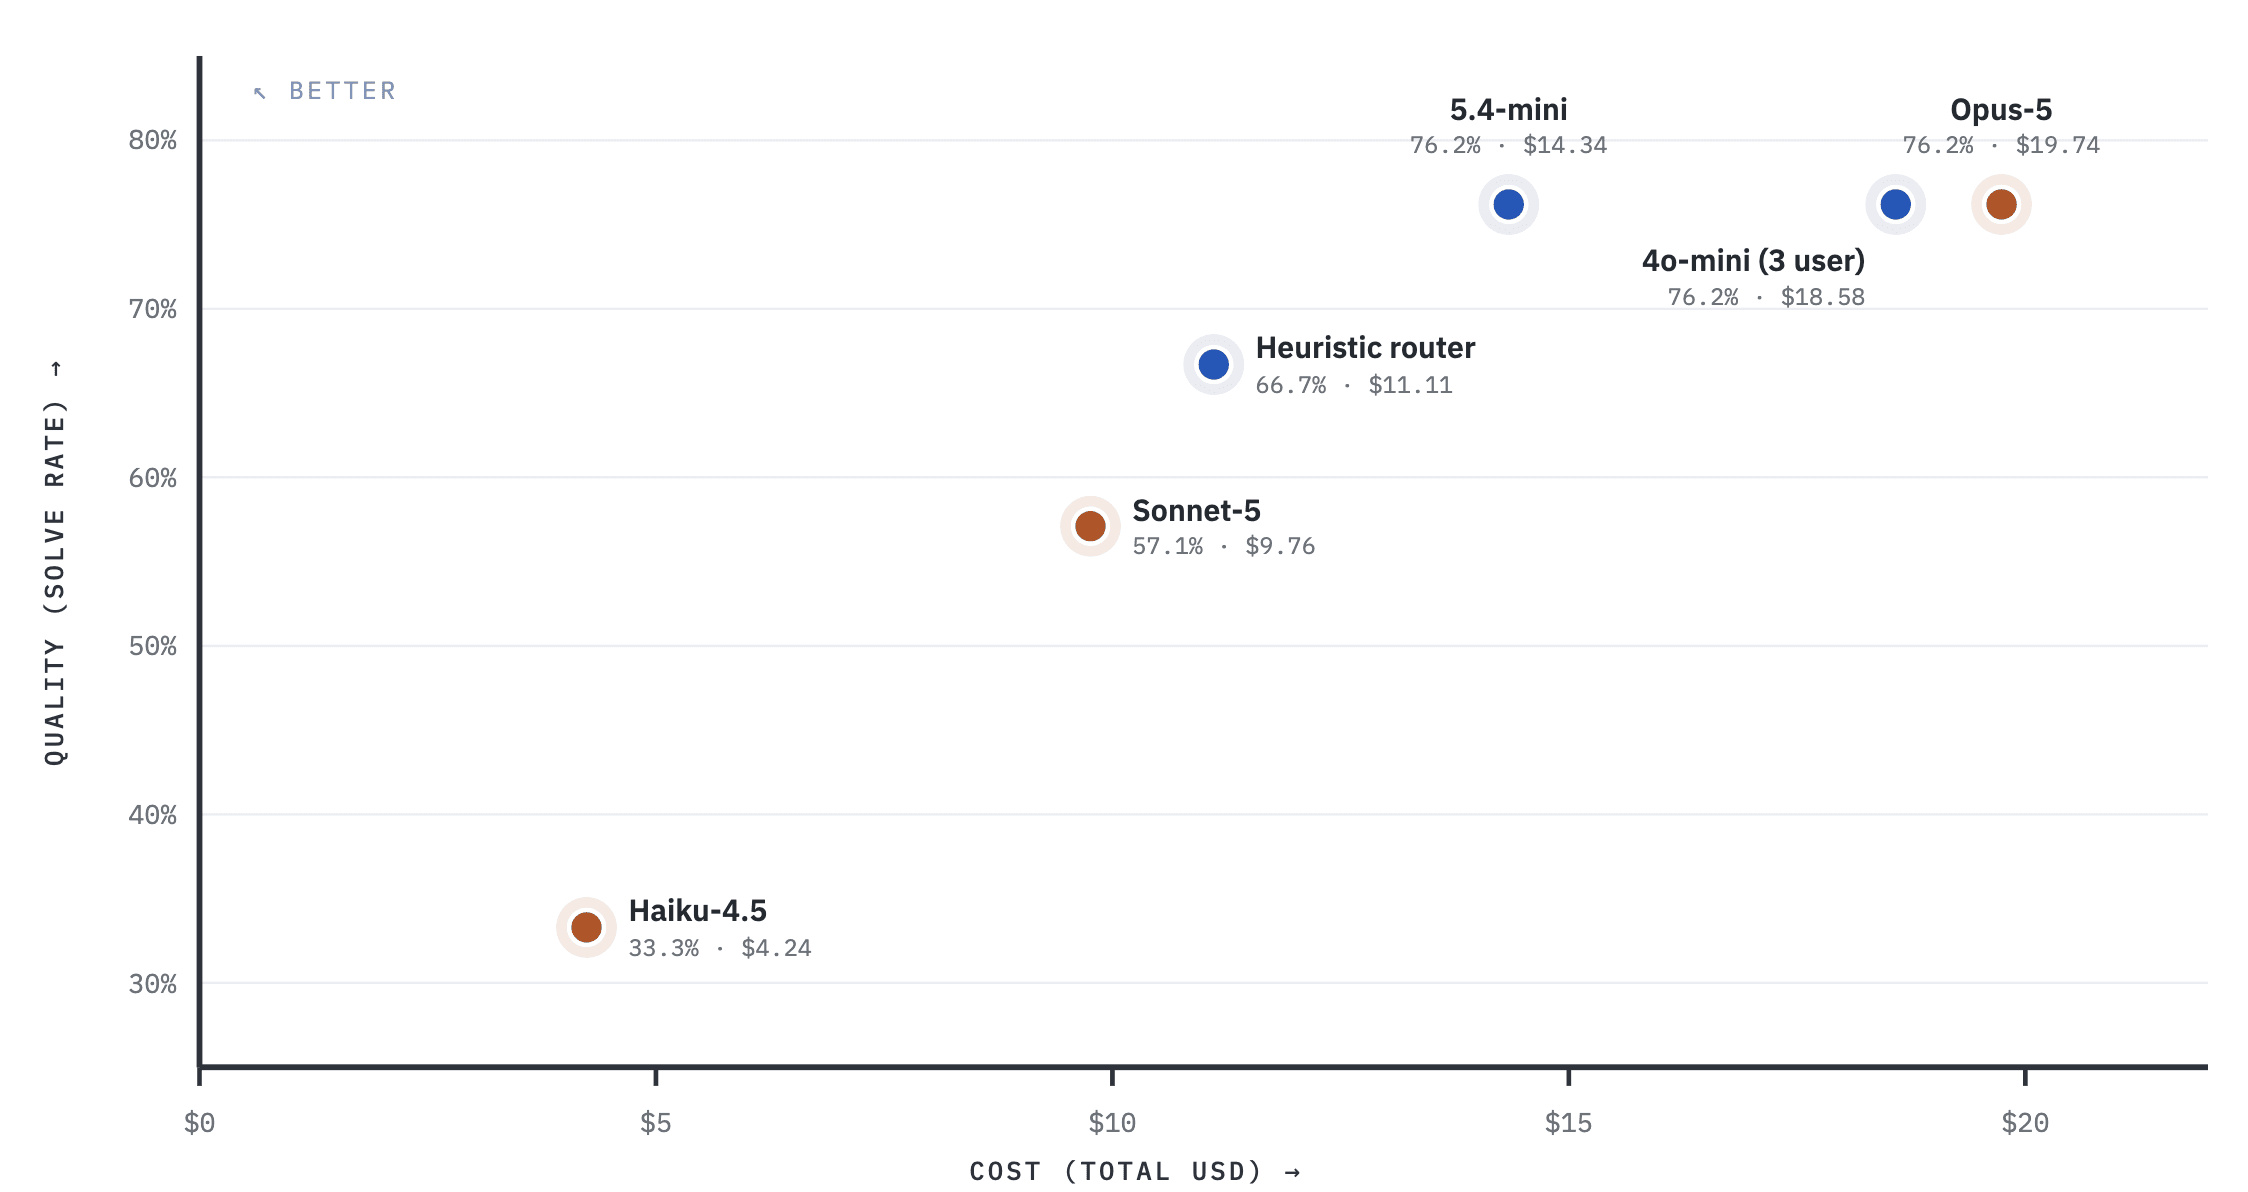
A model router sits between your application and one or more AI providers. Given a request — a chat completion, an image generation job, a text-to-video render — it decides which model to call based on quality expectations, latency budget, cost ceiling, availability, or policy constraints. That decision can be static (a lookup table), heuristic (token count and task type), or adaptive (learned from historical outcomes).
The key conceptual shift: the router is a decision layer, and a decision layer has its own failure modes. It can pick the wrong model, pick the right model too slowly, retry too aggressively, or silently substitute an alias that behaves differently from what you expect. A benchmark that only measures the downstream model's output quality tells you nothing about any of that.
1.2 Why Benchmarks Must Separate Model Quality from Routing Quality

The cleanest way to isolate routing performance is a controlled experiment where the prompt set, decoding parameters, and evaluation rubric stay fixed while only the routing policy changes. You run the same 500 prompts through three configurations: a single-provider baseline, a cost-optimized route with fallback, and a quality-first route with escalation. Then you compare end-to-end latency, cost, and quality — not per-model numbers.
When implementing this, a common mistake is letting the provider mix drift between runs. If run A used three providers and run B used two, you have measured the provider set, not the router. Gateways help here: a unified multimodal AI API gateway such as CCAPI exposes OpenAI, Anthropic, and Google models behind a single normalized interface, so swapping a routing policy doesn't require rewriting provider-specific clients. That normalization is what makes policy-to-policy comparison statistically meaningful rather than anecdotal.
1.3 Hidden Benchmark Signals: Overhead, Failover, and Observability
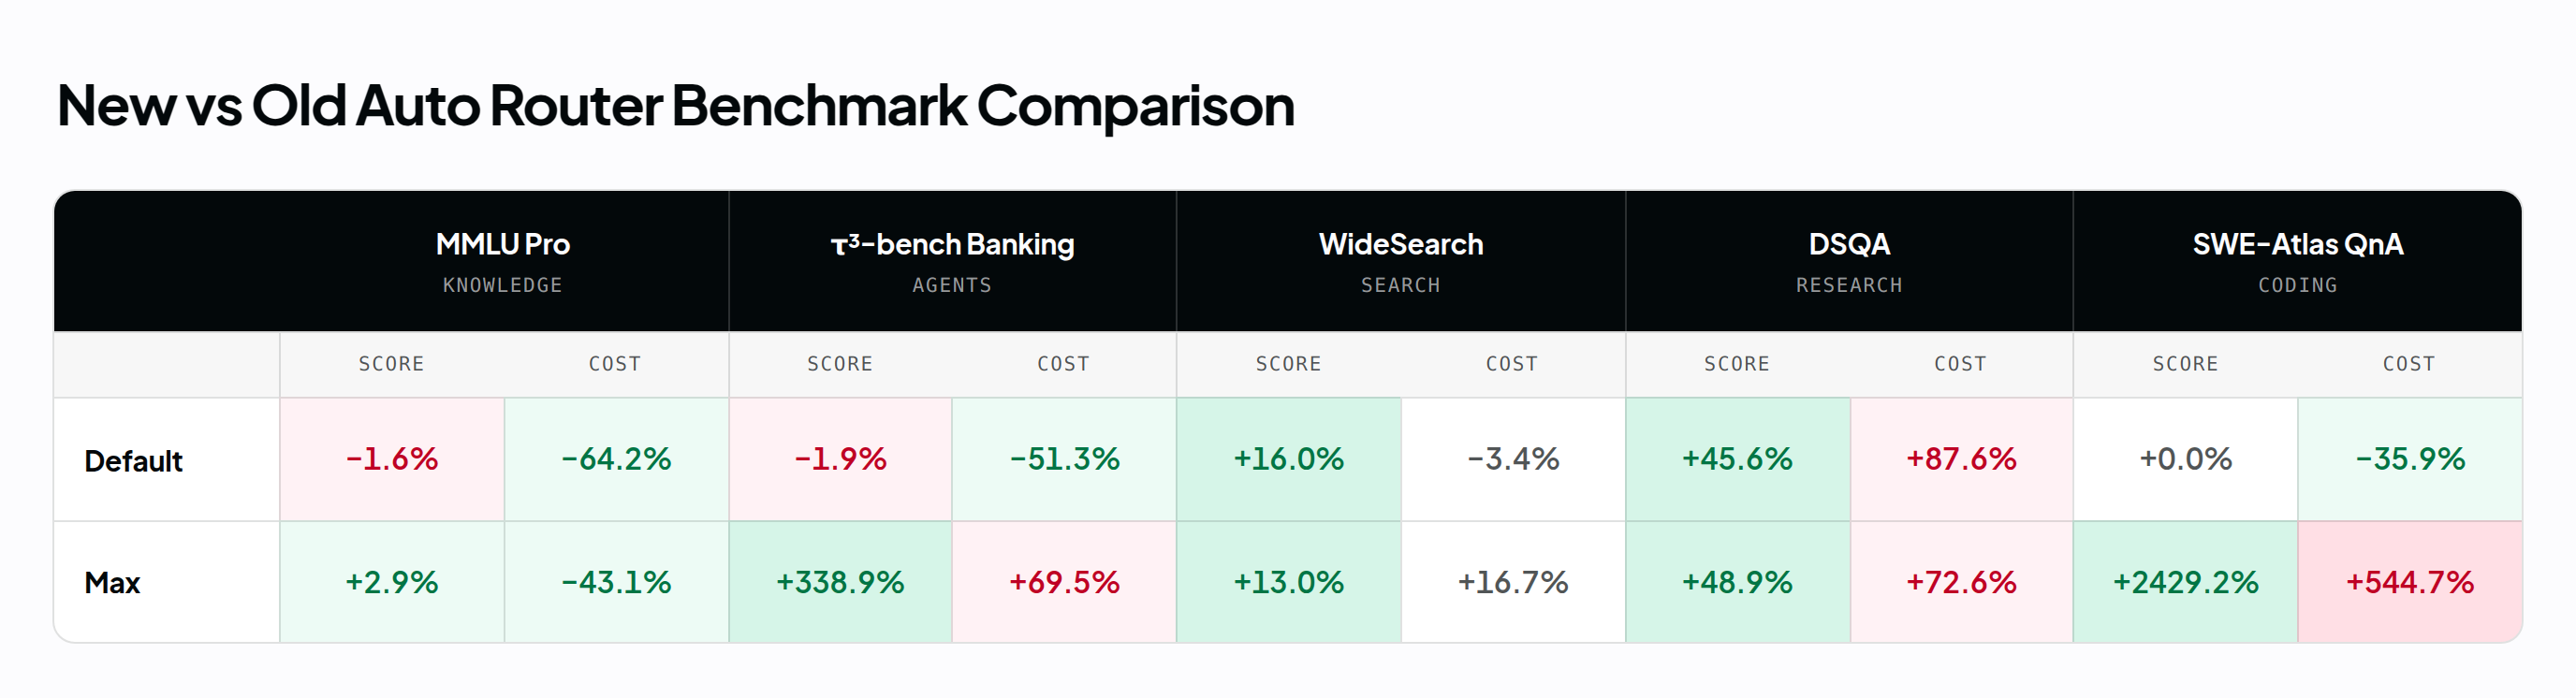
Some of the most consequential routing metrics never appear on a leaderboard.
- Routing decision latency — the time spent selecting a model, before any provider work begins.
- Retry overhead — the cumulative wall-clock cost of failed attempts, including the wasted tokens you still pay for.
- Provider failover time — how long until a health check detects a degraded provider and traffic shifts.
- Silent model aliasing — a provider quietly repointing a dated snapshot to a newer checkpoint mid-benchmark.
- Token accounting divergence — two providers tokenizing identical text differently enough to shift cost 10–20%.
- Observability gaps — missing trace IDs that make it impossible to attribute a bad response to a route.
In practice, failover time and retry amplification dominate real-world incident impact far more than a few hundred milliseconds of model latency difference. Yet most published benchmarks ignore both.
2. The Benchmarking Stack: Request Lifecycle, Metrics, and Test Design
2.1 Request Lifecycle and Where Latency Accumulates
Trace a single request: client → gateway ingress → auth and rate-limit check → routing decision → provider queue → inference → streaming response → retries or fallbacks → client egress.
Latency compounds at every hop. Auth and rate limiting are usually sub-millisecond. Routing decisions range from microseconds (static table) to tens of milliseconds (feature computation, embedding lookup, or a small classifier). Provider queue time is the volatile one — it can spike 10x during regional load. Inference is what you think you're benchmarking. Retries multiply everything before them.
The practical implication is that a router adding 30 ms of decision overhead is negligible against a 2-second inference, but catastrophic for a 90 ms classification call. Benchmark the router in the context of the workloads it will actually serve.
2.2 Core Metrics for LLM Router Performance
| Metric | What it tells you | Why it matters |
|---|---|---|
| p50 / p95 / p99 latency | Latency distribution shape | Averages hide tail pain |
| Time to first token (TTFT) | Perceived responsiveness | Drives streaming UX |
| Tokens per second | Steady-state throughput | Determines long-answer patience |
| Cost per successful request | True unit economics | Includes retries and failures |
| Success rate | Route reliability | First-order quality signal |
| Fallback rate | How often primary route fails | Reveals policy fragility |
| Provider error rate | Upstream health | Early outage detection |
| Quality score (task-specific) | Output usefulness | The only metric users feel |
LLM router performance differs from standalone model latency in one important way: it is a composite metric. A route can have excellent per-model latency and terrible end-to-end latency because of serial retries. Always report both.
2.3 Designing Multi-Provider AI Routing Tests
A reproducible harness for multi-provider AI routing needs controlled variance. Fix the prompt corpus and version it. Sweep concurrency in defined steps (1, 4, 16, 64) because contention exposes rate-limit behavior that single-threaded tests never reveal. Test streaming and non-streaming separately. Pin temperature to zero for quality comparisons and to production values for latency realism. Vary context window sizes deliberately, since long-context requests hit different provider quotas.
A minimal harness in Python looks like this:
import asyncio, time, statistics

async def timed_call(client, route, prompt):
    start = time.perf_counter()
    ttft = None
    tokens = 0
    try:
        stream = await client.chat(route=route, prompt=prompt, stream=True)
        async for chunk in stream:
            if ttft is None:
                ttft = time.perf_counter() - start
            tokens += len(chunk.text.split())
        return {
            "route": route,
            "ttft_ms": ttft * 1000,
            "total_ms": (time.perf_counter() - start) * 1000,
            "tokens": tokens,
            "ok": True,
        }
    except Exception as exc:
        return {"route": route, "ok": False, "error": type(exc).__name__}

async def run_suite(client, routes, prompts, concurrency=8):
    sem = asyncio.Semaphore(concurrency)
    async def bounded(r, p):
        async with sem:
            return await timed_call(client, r, p)
    results = await asyncio.gather(*[bounded(r, p) for r in routes for p in prompts])
    return results

def summarize(results):
    ok = [r for r in results if r["ok"]]
    lat = sorted(r["total_ms"] for r in ok)
    return {
        "success_rate": len(ok) / len(results),
        "p50": statistics.median(lat),
        "p95": lat[int(len(lat) * 0.95)],
        "p99": lat[int(len(lat) * 0.99)],
    }
Run warm-up iterations and discard them. Cold starts distort p99 badly enough to change architectural decisions.
2.4 Multimodal Benchmark Considerations
Text, image, audio, and video generation stress a router in completely different ways. A text completion streams tokens; an image API returns one payload after several seconds; a text-to-video render can take minutes and often runs asynchronously with polling or webhooks. Cost granularity varies too — images bill per render at different resolutions, video bills per second of output.
This is where multimodal routing benchmarks get messy, because every provider normalizes responses differently. Running all four modalities through one gateway — as CCAPI does across its model catalog at /models/ — removes the integration variable and lets you compare modality-level routing policies on equal footing.
3. Model Selection Benchmarks: Quality, Cost, and Speed Trade-Offs
3.1 Defining Quality Benchmarks for Model Selection
Generic leaderboards are a poor proxy for your workload. Model selection benchmarks should be tied to business outcomes: does the answer resolve the ticket, does the JSON parse on the first try, does the generated image pass brand review? Build a rubric, label a held-out set of 100–300 real requests, and score every route against it. Automated evals handle deterministic checks (schema validity, citation presence); human preference scoring handles subjective quality.
Hallucination checks deserve their own axis. A model that is 15% slower but fabricates 80% fewer facts is usually the better route for anything customer-facing.
3.2 Cost-Aware Routing and Transparent Pricing
Per-token pricing is only the visible layer. The real cost includes retry tokens, tokenization differences between providers on identical text, provider minimums, and output-length variance. A route that produces 20% more verbose answers at the same per-token rate costs 20% more.
Transparent, comparable pricing is what makes cost-aware routing tunable rather than guesswork. CCAPI's pay-as-you-go model, detailed at /pricing, avoids subscription tiers and lets you compute cost per successful request directly from token accounting.
3.3 Speed vs Accuracy: When Fast Enough Beats Best
Define an acceptable latency threshold per task. For autocomplete, 400 ms TTFT is generous. For a nightly report generator, 30 seconds is fine. Once the threshold is set, the highest-quality model that fits inside it wins — not the highest-quality model, period. Escalation to a premium tier is justified only when a cheap route fails a quality gate or confidence check.
3.4 Benchmarking Vendor Lock-In and Switching Costs
Switching costs are a legitimate benchmark dimension: integration effort, API normalization burden, credential sprawl, reliance on provider-exclusive features, and migration time. A gateway designed for zero vendor lock-in keeps those numbers low, which shows up as faster model swaps when a cheaper or better option appears.
4. AI API Gateway Benchmarks: Comparing Routing Architectures
4.1 Centralized Gateway vs SDK-Level Routing
| Dimension | Centralized gateway | SDK-level routing |
|---|---|---|
| Policy enforcement | Uniform, server-side | Scattered across clients |
| Observability | Single trace timeline | Fragmented per service |
| Latency overhead | One extra network hop | None (in-process) |
| Upgrade path | Central, atomic | Requires client redeploys |
| Credential management | Central vault | Distributed secrets |
Centralized routing wins on governance; SDK routing wins on raw latency. For most teams past prototype stage, governance is the binding constraint.
4.2 Failover, Rate Limits, and Provider Outages
Benchmark failover explicitly. Simulate a provider returning 429s at a 100% rate, then a 50% rate, then a 5% rate with elevated latency. Measure time-to-detect, time-to-shift, and error rate during the window. Test circuit breaker thresholds and queueing behavior under rate-limit storms — a router that queues instead of shedding can turn a degradation into an outage.
4.3 Security, Compliance, and Observability Benchmarks
Score your gateway on API key management, data residency controls, PII handling, audit trail completeness, and role-based access. On observability, the test is simple: can you reconstruct a single request's full path — route chosen, provider called, tokens billed, retries issued — from a trace ID alone? If not, your cost attribution and incident response will both be guesswork.
4.4 Multimodal Throughput and API Normalization
Gateways normalize wildly different provider schemas into one response contract. Benchmark the conversion overhead and, more importantly, the consistency: does an image generation API call return the same envelope whether it hit a diffusion model or a natively multimodal one? CCAPI's unified multimodal AI API gateway is built around this abstraction, covering text, image, audio, and video endpoints under one auth and billing surface.
5. Interpreting Model Router Benchmarks Without Misleading Yourself
5.1 Common Pitfalls in LLM Router Performance Testing
The recurring mistakes: benchmarking only one provider and calling it a router test; ignoring cold starts; using sanitized prompts that don't resemble production traffic; reporting means instead of percentiles; and failing to pin model versions, so a mid-week provider update silently invalidates your baseline.
5.2 Statistical Significance, Variance, and Warm-Up Effects
Provider infrastructure is shared, so variance is inherent. Use confidence intervals, not point estimates. With 100 samples per route, a 200 ms p95 difference is often noise. Run repeated trials across different hours, and discard warm-up runs explicitly. Report the interval; a chart without error bars is a chart you shouldn't trust.
5.3 Workload Drift and Benchmark Decay
Production traffic changes shape — longer prompts, new modalities, new languages. Benchmarks decay. Schedule re-benchmarking monthly and monitor for input-distribution drift so you know when a result is stale rather than merely old.
5.4 Hidden Costs of Retries, Tokenization, and Context Windows
Retry amplification is the most under-modeled cost. If 8% of requests fail and retry twice, effective cost per success rises by roughly 16–24% depending on whether failed attempts are billed. Tokenizer mismatch between providers adds a few percent on identical text. Context truncation removes information, silently changing quality. A unified interface that standardizes token accounting and surfaces retry counts makes these costs visible instead of invisible.
6. Real-World Implementation: Lessons from Production Routing
6.1 High-Volume Customer Support Routing
The common pattern: classify intent cheaply, route simple queries to a fast, inexpensive model, and escalate complex cases to a premium tier. Track containment rate, cost per resolution, and fallback frequency. Containment rate is the metric that actually moves the P&L.
6.2 Multimodal Content Generation Pipeline
A content pipeline might route copywriting to a text model, hero images to an image generation API, voiceover to a speech model, and short clips to a text-to-video endpoint. Each modality has its own latency tolerance and cost ceiling — images tolerate a 20-second render, interactive copy does not. Routing policies should be per-modality, not global.
6.3 Cost-Constrained Batch Processing
Batch workloads invert the priority: quality threshold fixed, cost minimized, deadlines soft. Queue requests, respect provider quotas, and use deadline-aware routing that shifts to cheaper routes when the deadline is far and premium routes when it's near.
6.4 Operational Dashboards and Alerting
Dashboards need latency percentiles, error rate, cost per hour, fallback rate, and per-provider health. Alerts should fire on drift (input distribution shifts), rate-limit spikes, and quality regressions — not on every transient 500.
7. Advanced Techniques for Model Router Benchmarking
7.1 Shadow Routing and Canary Benchmarks
Shadow routing duplicates live traffic to a candidate route without affecting users, letting you compare quality, latency, and cost on real inputs. Canary benchmarks promote that candidate to 1–5% of live traffic once shadow results look favorable.
7.2 A/B Testing Routing Policies with Online Metrics
Run controlled experiments against business metrics: conversion, resolution time, user satisfaction, cost per task. Offline benchmarks predict; online experiments decide.
7.3 Bayesian Optimization and Adaptive Model Selection
Adaptive routers treat model choice as a bandit problem — explore occasionally, exploit the best-known route, and update beliefs as outcomes arrive. Guardrails matter: cap exploration at a small traffic slice and always retain a deterministic fallback.
7.4 Benchmarking Under Provider Rate Limits and Degradation
Build degraded-mode tests: throttle to 10% capacity, inject 800 ms of added latency, fail a single region. Measure whether the router degrades gracefully or collapses. This is the test most teams skip, and it's the one that predicts incident severity.
Conclusion
Model router benchmarks are not model benchmarks with a different label. They measure a decision layer whose overhead, failover behavior, and accounting accuracy shape real-world outcomes more than any leaderboard delta. Build a harness that isolates routing from model quality, report percentiles with intervals, test failure modes deliberately, and re-benchmark as workloads drift. Whether you run your own gateway or use a unified multimodal AI API gateway like CCAPI — with its transparent pricing and zero vendor lock-in across OpenAI, Anthropic, and Google models — the discipline is the same: measure the router you actually deployed, not the one you imagined.